Jan28

Sponsored Post
Most leadership dashboards look impressive. Revenue curves. Output charts. Delivery timelines. These indicators feel solid and objective, yet they rarely explain why one organization adapts smoothly while another stalls under pressure. Experienced leaders learn this lesson early. The health of a company shows up first in places that rarely appear on reports.
The strongest leadership teams track invisible metrics. These signals reveal how people think, speak, and connect when conditions change. They surface risks before performance drops and highlight strength before growth accelerates. This article explores the measures that sit beneath productivity and finance, and explains how advanced leaders use them to steer organizations with precision.
Seeing invisible metrics requires structured thinking and systems-level judgment. This skill develops through experience, but education accelerates it. Advanced training in Business Administration exposes leaders to organizational theory, behavioral economics, governance models, and strategic analysis. These disciplines train leaders to look beyond surface performance.
Doctoral-level programs take this further by teaching how to evaluate organizations as living systems. They emphasize causal thinking, longitudinal patterns, and second-order effects. Leaders learn how culture shapes decisions, how incentives distort behavior, and how informal networks move faster than formal hierarchies.
For future Business Administration experts, an online DBA accredited degree provides a strong foundation for this level of insight. Programs like this focus on applied research, executive decision-making, and real organizational complexity. Graduates develop the ability to translate abstract signals into strategic action. That capability separates operational managers from true organizational architects.
Psychological safety rarely appears in performance reviews, yet it determines how teams behave when stakes rise. Leaders who measure it gain early insight into execution risk.
This metric reflects whether people feel safe to speak openly, challenge assumptions, and surface problems early. When safety is high, teams correct course quickly. When it erodes, issues stay hidden until they become expensive.
Top leaders observe psychological safety through behavior rather than surveys alone. They watch who speaks in meetings and who stays quiet. They notice how errors get discussed. They track how often frontline teams escalate concerns without fear of blame.
Indicators often include patterns like:
These signals help leaders predict delivery quality and innovation capacity. Teams with strong psychological safety adapt faster, share context freely, and execute with fewer surprises.
Every organization runs on stories. Strategy decks and mission statements matter less than the narrative people repeat when leadership leaves the room. Narrative coherence measures how consistently teams understand direction, priorities, and purpose.
When narratives fracture, execution slows. Teams pull in different directions while believing they align. Leaders who track this metric listen carefully to how people describe goals in their own words.
Narrative coherence shows up in language consistency across departments. It appears in how middle managers explain trade-offs. It becomes visible during change initiatives when teams either connect actions to purpose or treat them as isolated tasks.
Strong leaders test narrative alignment through informal conversations, leadership skip-levels, and cross-functional reviews. They listen for shared meaning, not rehearsed slogans. When narratives align, coordination improves without additional process. When they diverge, friction rises even if metrics still look healthy.
Org charts describe authority, but real work moves through networks. Network strength measures how information flows, who influences decisions, and where bottlenecks form. This metric becomes critical during periods of growth or transformation.
Leaders who understand informal networks know where to intervene and where to step back. They identify connectors who spread context quickly. They notice isolated teams that miss critical information. They see how trust moves faster than policy.
Network strength becomes visible through collaboration patterns, response speed across teams, and dependency clusters. Leaders often map this informally at first by observing who people turn to under pressure. Over time, these patterns guide staffing decisions, change rollouts, and leadership development.
Ignoring network strength leads to failed initiatives that look sound on paper. Measuring it allows leaders to design change that respects how work actually happens.
Decision latency measures how long it takes to move from information to action. It reflects clarity, trust, and authority distribution. High latency often signals fear, misaligned incentives, or unclear ownership.
Top leaders track this metric across different decision types. Strategic choices, operational adjustments, and customer responses each reveal different constraints. When latency increases, leaders investigate causes rather than pushing harder.
Common signals include repeated re-approvals, excessive alignment meetings, or decisions that reverse quickly. These patterns suggest uncertainty or weak accountability. Reducing latency improves adaptability and employee confidence.
Leaders who measure decision latency gain insight into structural issues before they impact results. They redesign decision rights, simplify governance, or clarify priorities based on these observations.
Output measures what gets delivered. Learning velocity measures how quickly teams improve. In complex environments, learning speed predicts long-term performance more accurately than short-term output.
This metric reflects how teams process feedback, update assumptions, and integrate new information. Leaders observe learning velocity through iteration cycles, post-project reviews, and behavior changes after failure.
High learning velocity appears when teams adjust methods without defensiveness. It shows up when feedback leads to visible improvement rather than surface compliance. Leaders who value this metric invest in reflection, coaching, and safe experimentation.
Organizations that track learning velocity build resilience. They recover faster from setbacks and compound improvement over time.
Keywords: Analytics, Management, Leadership
 Friday’s Change Reflection Quote – Saeculum Leadership – Leadership Stewardship Demands Transparency
 The Corix Partners Friday Reading List - July 24, 2026
 The borders have moved, and leadership has not yet caught up
 No More Hold Music: How AI is Fixing the UK’s Customer Service Crisis
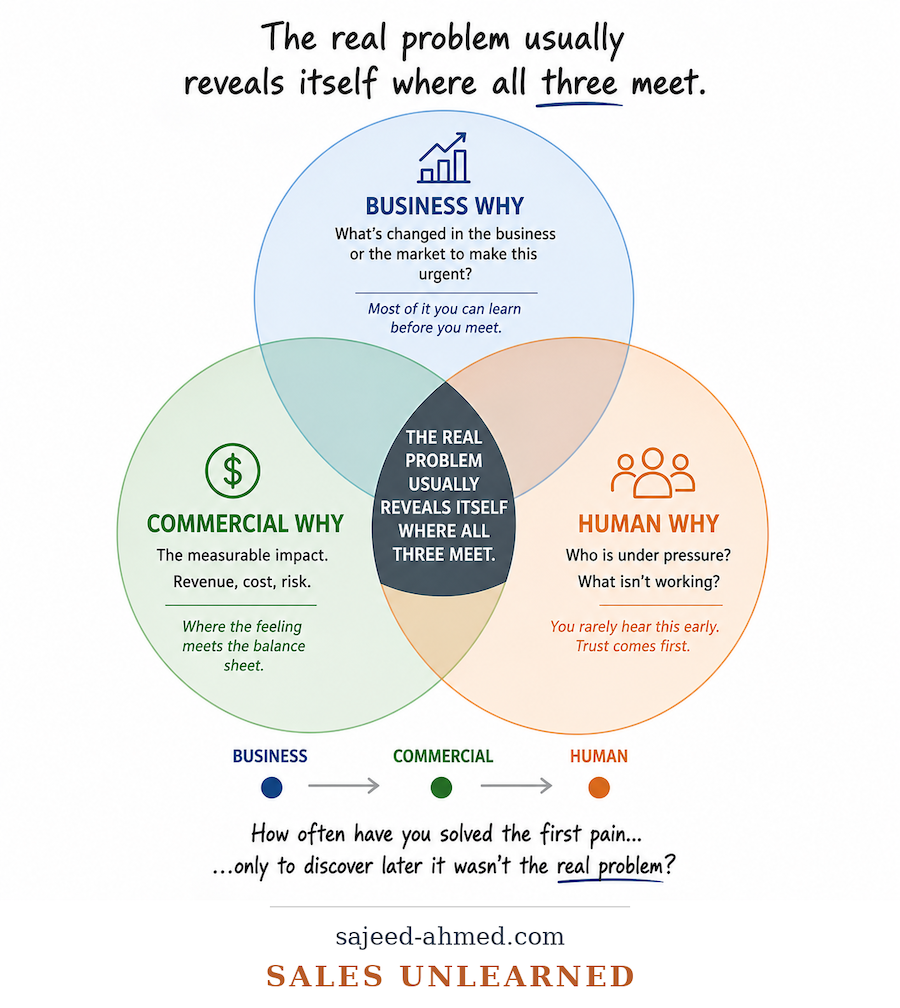 Why the First Customer Pain Is Rarely the Real Problem in Enterprise Sales