Unlock access to Thinkers360 AI to fast-track your search for analysts and influencers.
This feature is available for Enterprise Lite and Enterprise Members Only.
You have been temporarily restricted. Please be more thoughtful when adding content for your portfolio. Your portfolio and digital media kit and should be reflective of the professional image you wish to convey. Accounts may be temporarily restricted if we receive reports of spamming or if the system detects excessive entries.
Membership
Publish your original ideas on the Thinkers360 platform!
This feature is available for Pro and Pro-Plus Members Only.
Speaker Bureau functionality whereby individuals can be featured speakers within our Speaker Bureau service and enterprises can find and work with speakers.
This feature is available for Pro, Pro-Plus, Premium and Enterprise Members Only.
Highlight your featured products and services within our company directory for enhanced visibility to active B2B buyers worldwide.
This feature is available for Pro, Pro Plus, Premium and Enterprise Members Only.
Publish on the Web’s #1 Thought Leadership Blog.Join the elite. Ranked the top thought leadership blog by Feedspot (2021–2025), Thinkers360 offers you more than just a platform - it offers authority. Share your insights with our community and tap into a combined network of over 100M followers through our peer-to-peer marketplace.
You’ve reached your daily limit for entering quotes. Please only add personally-authored content which is reflective of your digital media kit and thought leadership portfolio.
Thinkers360 Content Library
For full access to the Thinkers360 content library, please join ourContent Planor become a contributor by posting your own personally-authored content into the system viaAdd PublicationorImport Publication.
Dashboard
Unlock your personalized dashboard including metrics for your member blogs and press releases as well as all the features and benefits of our member plans!
Kanban: Service Level Expectation (SLE) and the different types of work items
Nov30
Example Workflow
I want you to imagine that you’ve got a workflow. In this workflow, imagine there’s a backlog. In the backlog, there are lots of items, maybe there are different types of work going on:
blue work; and
yellow work in this case.
To-Do Column
There’s a “To-Do Column” where we’re confirming to a customer that we’re going to start something.
In-Progress Column
Then we’re actually doing the work. Maybe we have two “In-Progress” dates:
in progress one and
in progress two.
Done Column
Then we’re basically shipping what we’ve done to our customers.
Review Column
Then we’re reviewing some outcomes.
That would be the workflow that we’re going to talk about today.
Different Types of Work Item Types in Kanban
On the workflow referred to above, not only are there blue items and yellow items, but imagine also there are some red items.
There are different types of work on the system.
How many “Started” and “Finished” points can you have on a workflow?
You can have a number of started points and finished points on a workflow.
In this example, imagine we only have one.
The “Started” point is the border between the “Backlog” and “To-Do” columns.
The “Finished” point is the border between the “Shipped” and “Review outcomes” (because we care about outcomes). You could argue we should be doing it later than that, getting the feedback, seeing what’s going on, and so forth.
Service Level Expectation (SLE)
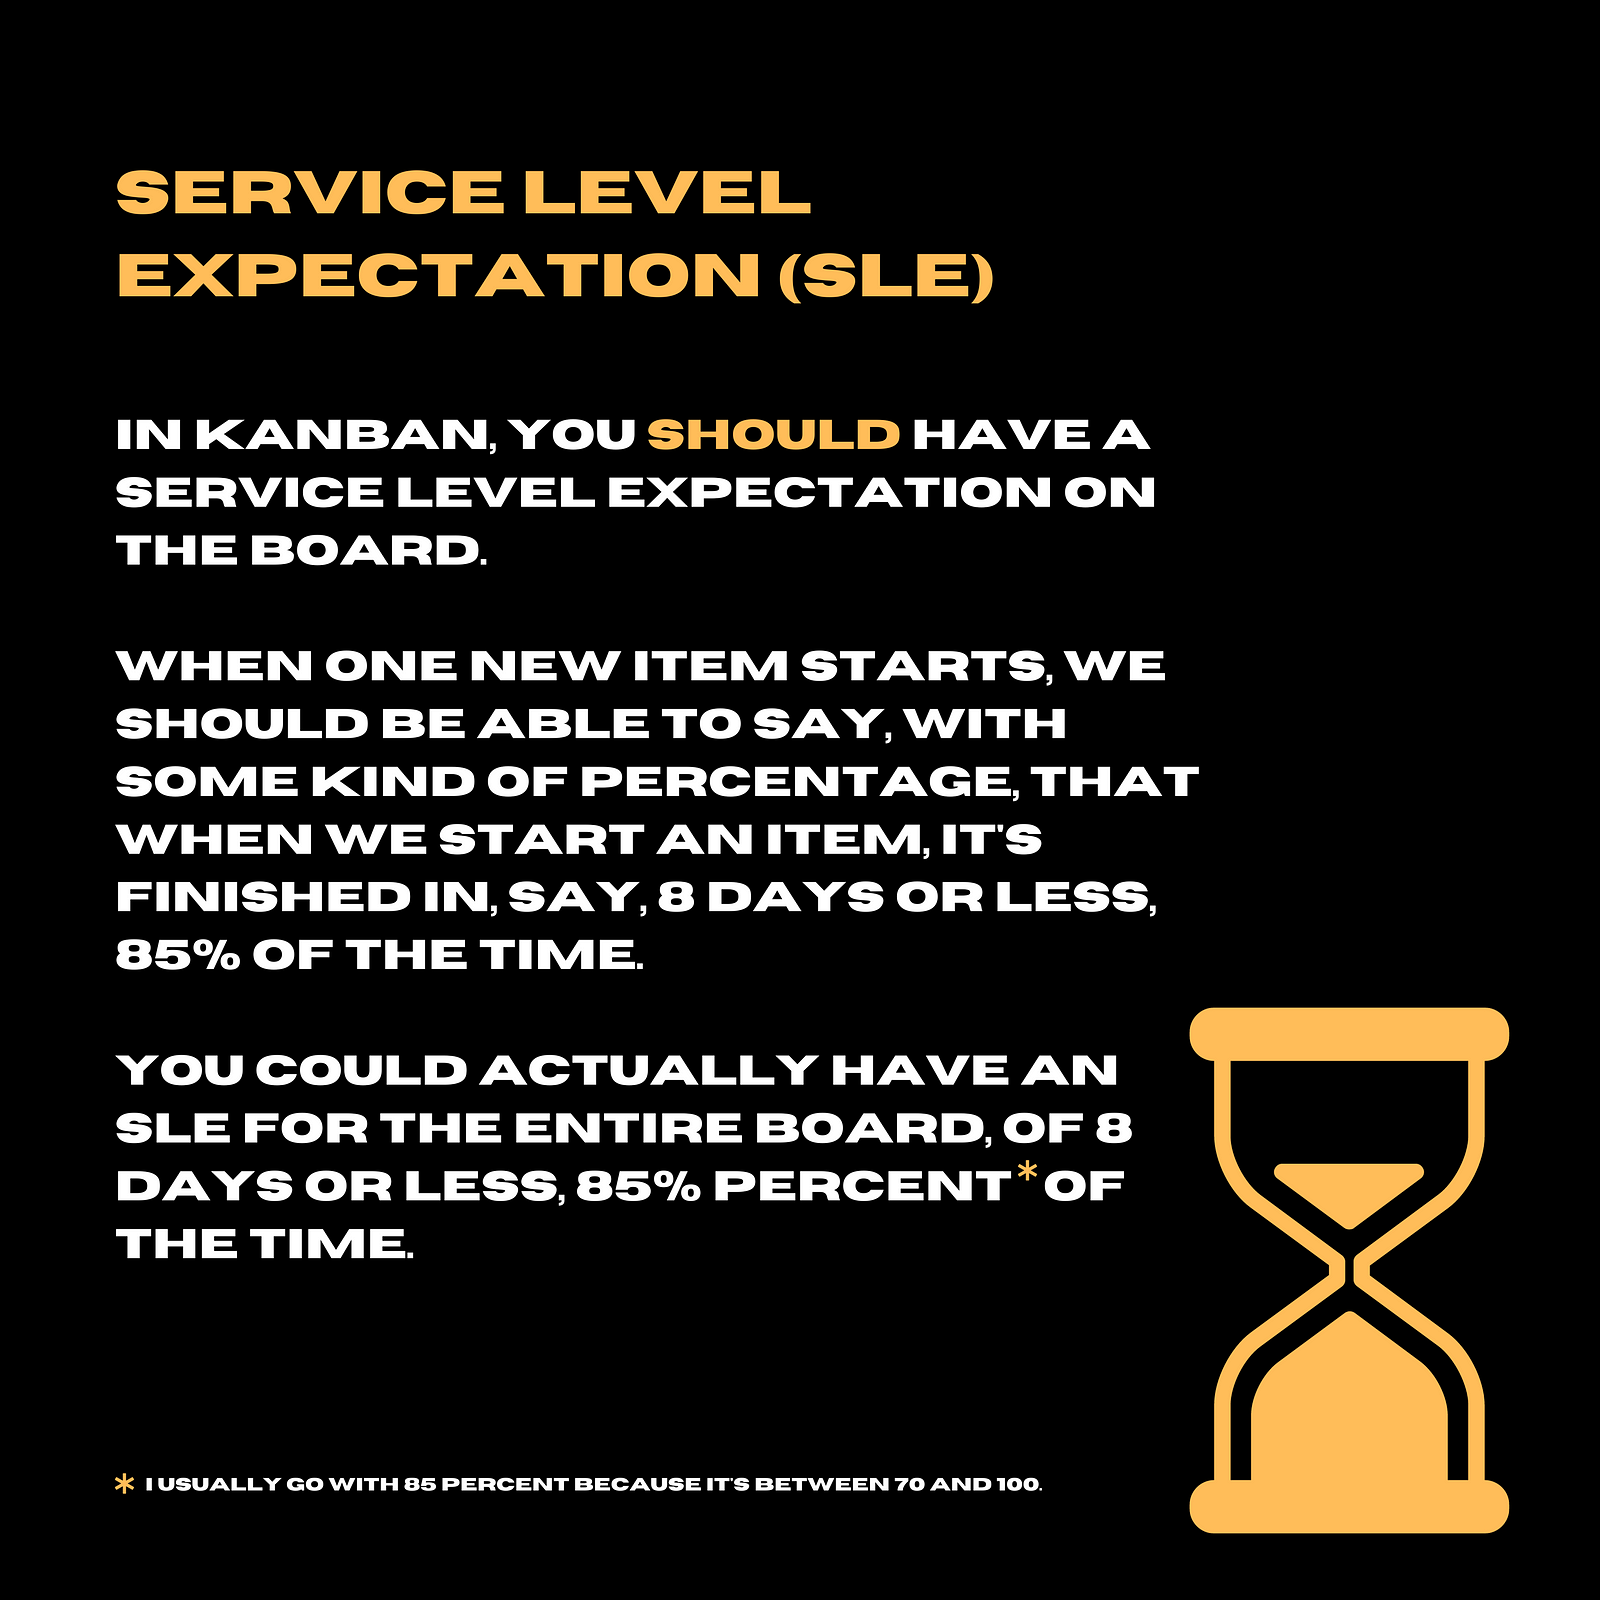
In Kanban, it’s possible to have a Service Level Expectation (SLE). Not only is it possible, but you should have a Service Level Expectation on the board.
When one new item starts (based on either an initial guess, statistics, or performance) we should be able to say, with some kind of percentage (I usually go with 85 percent because it’s between 70 and 100) that when we start an item, it’s finished in, say, 8 days or less, 85% of the time.
You could actually have an SLE for the entire board, of 8 days or less, 85% percent of the time.
“But some work is different from others” and “How do we use SLE in non-software work?”…
I have done a lot of work in non-software, since 2018 in particular, and I get comments from people that some work is different from others.
It’s quite a strong message that people are giving me that some work is different from others.
What I also noticed was that when I tell people, let’s say, on this imaginary board, that:
you’ve got an item and
imagine the item (say the Red Item for example) is actually four days old.
That might actually not look too bad on the board because it’s eight days or less, 85% of the time and it’s in the second “asked” column on the board.
Say it’s four days, it might be okay.
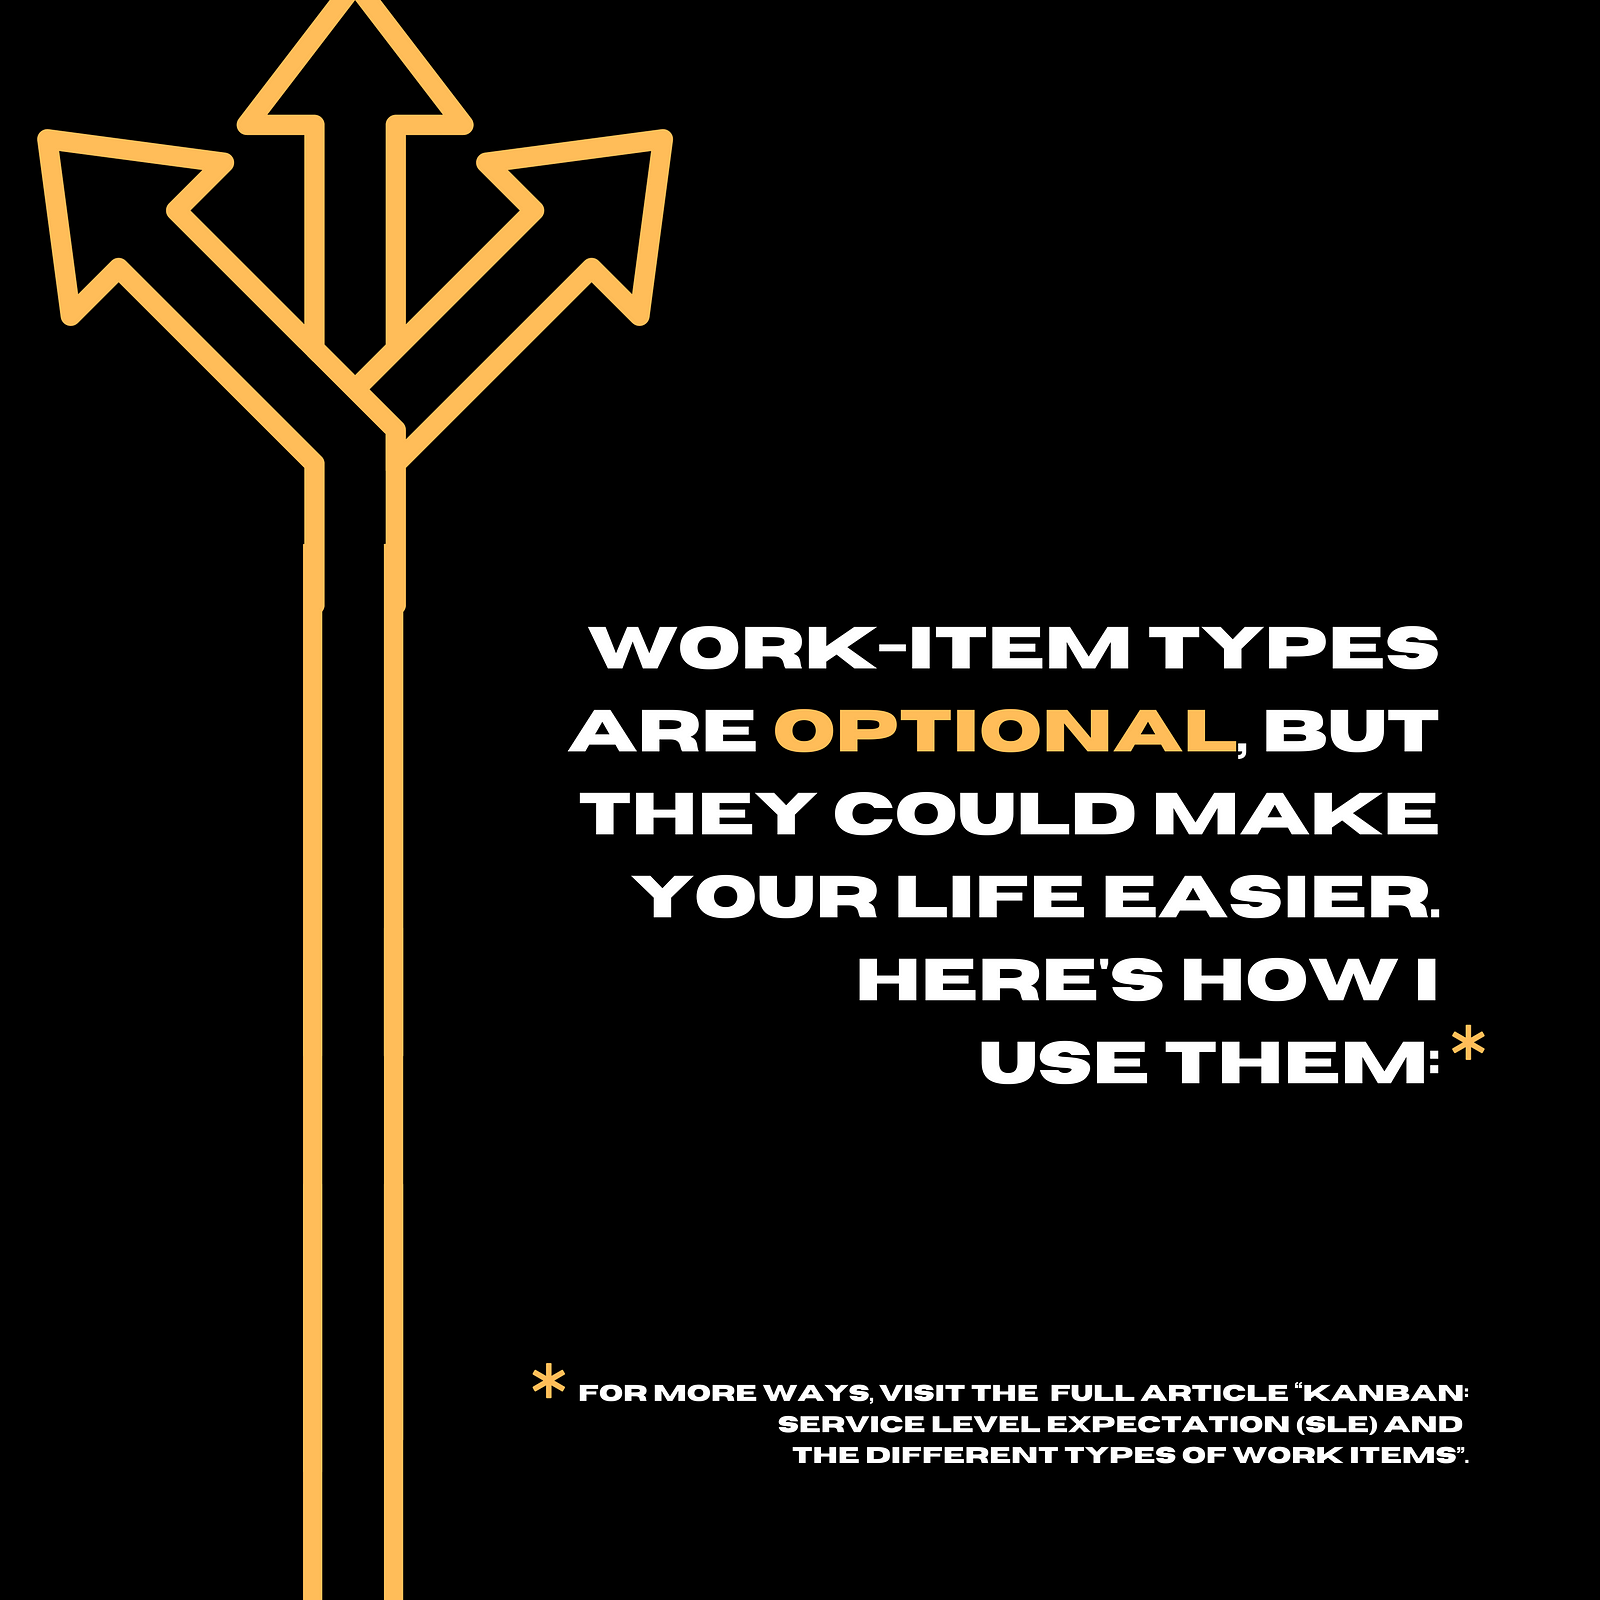
But actually, that work item type might typically take less. In this example, I have come up with a service level expectation for each work item type.
Work-item types are optional, but they could make your life easier. Here’s how I use them:
You don’t have to use work item types, it’s optional. I find them very useful.
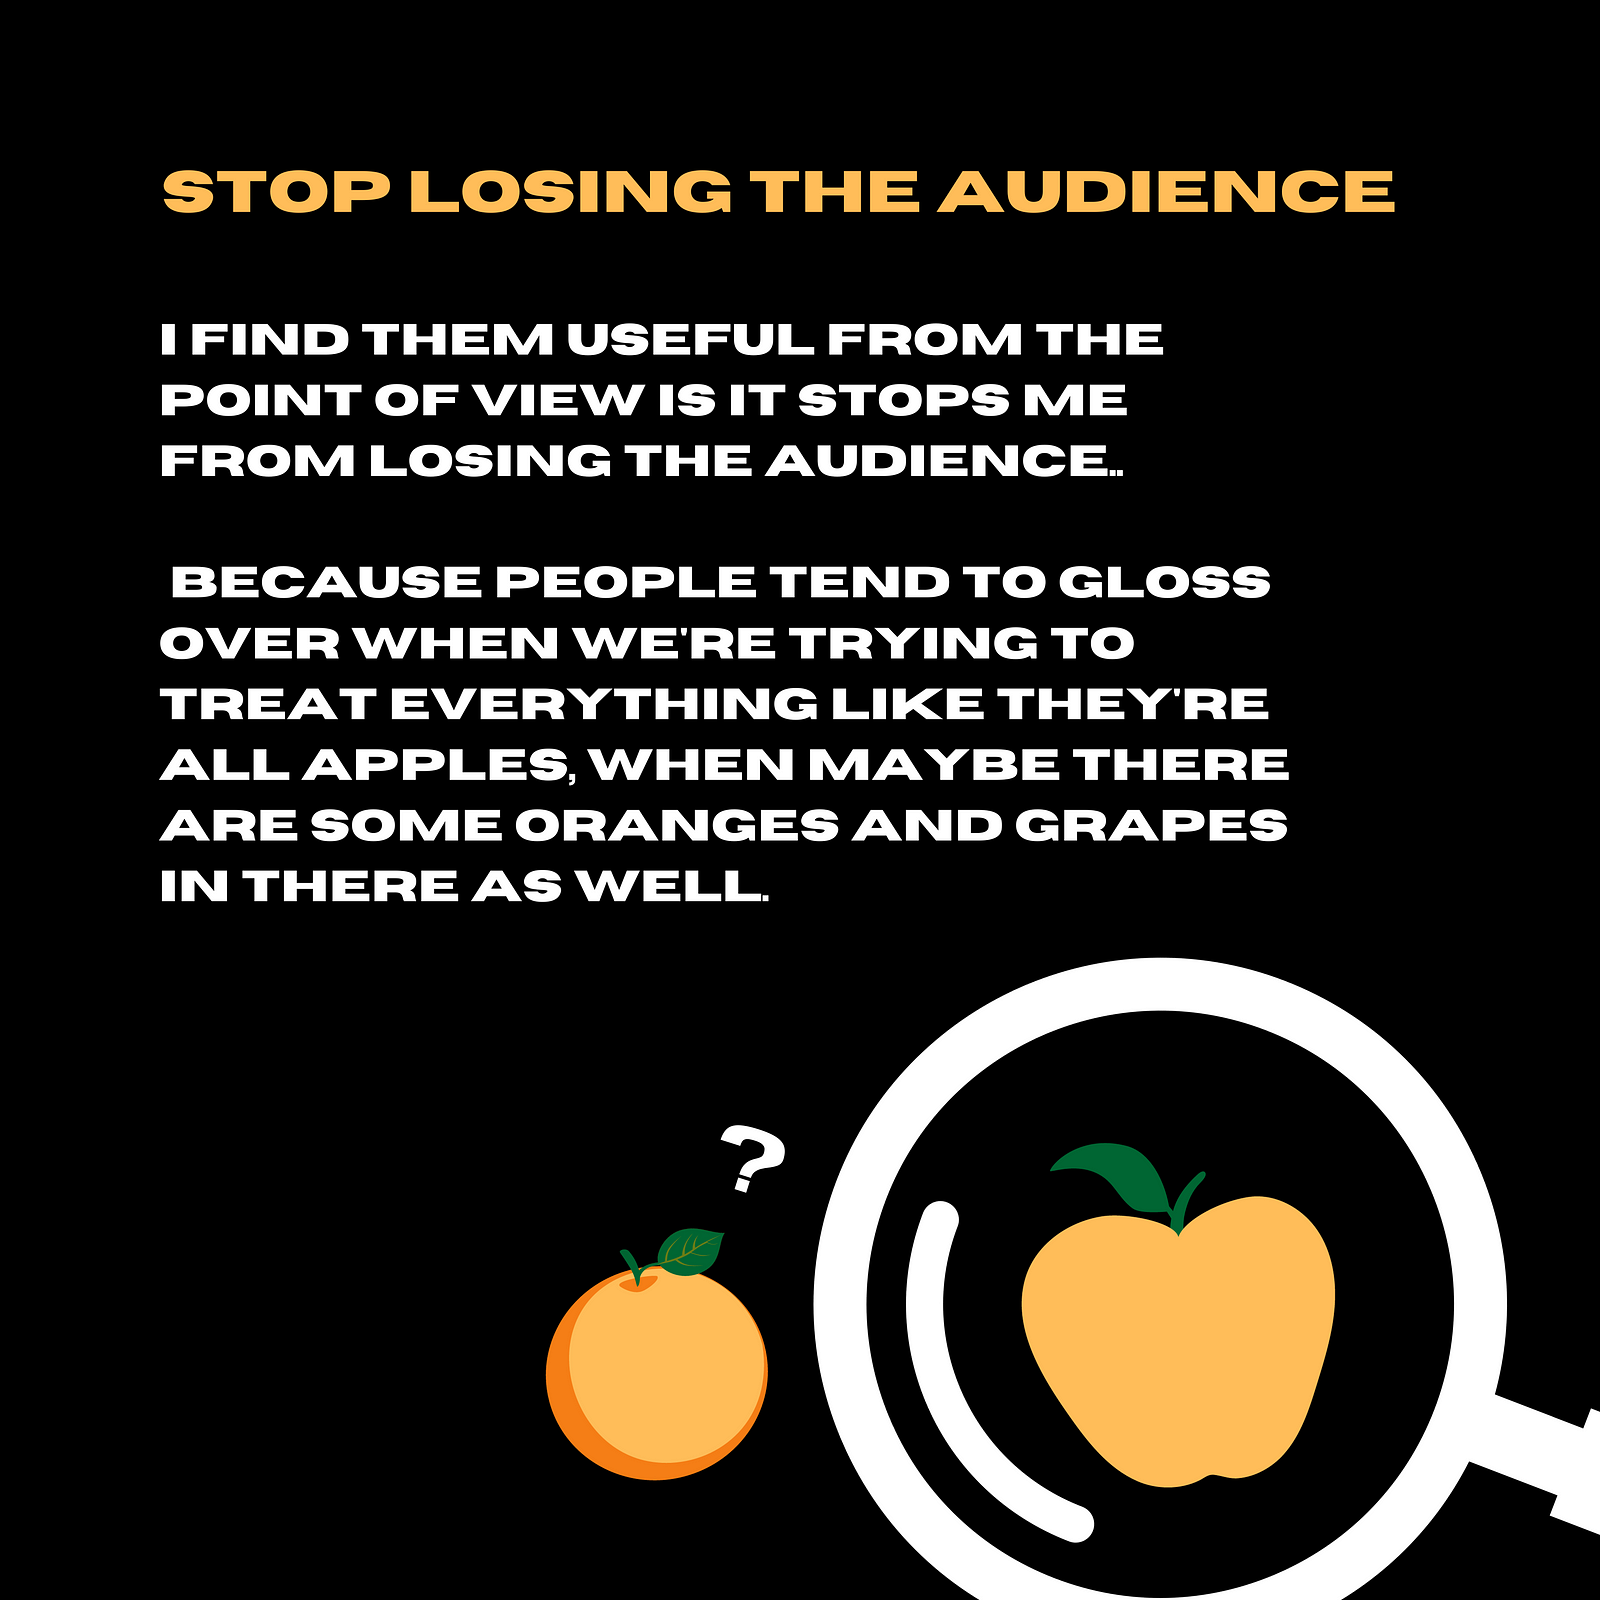
I find them useful from the point of view is it stops me from losing the audience. Because people tend to gloss over when we’re trying to treat everything like they’re all apples, when maybe there are some oranges and grapes in there as well. Even if statistically, there’s some kind of an argument to be made, psychology doesn’t really work.
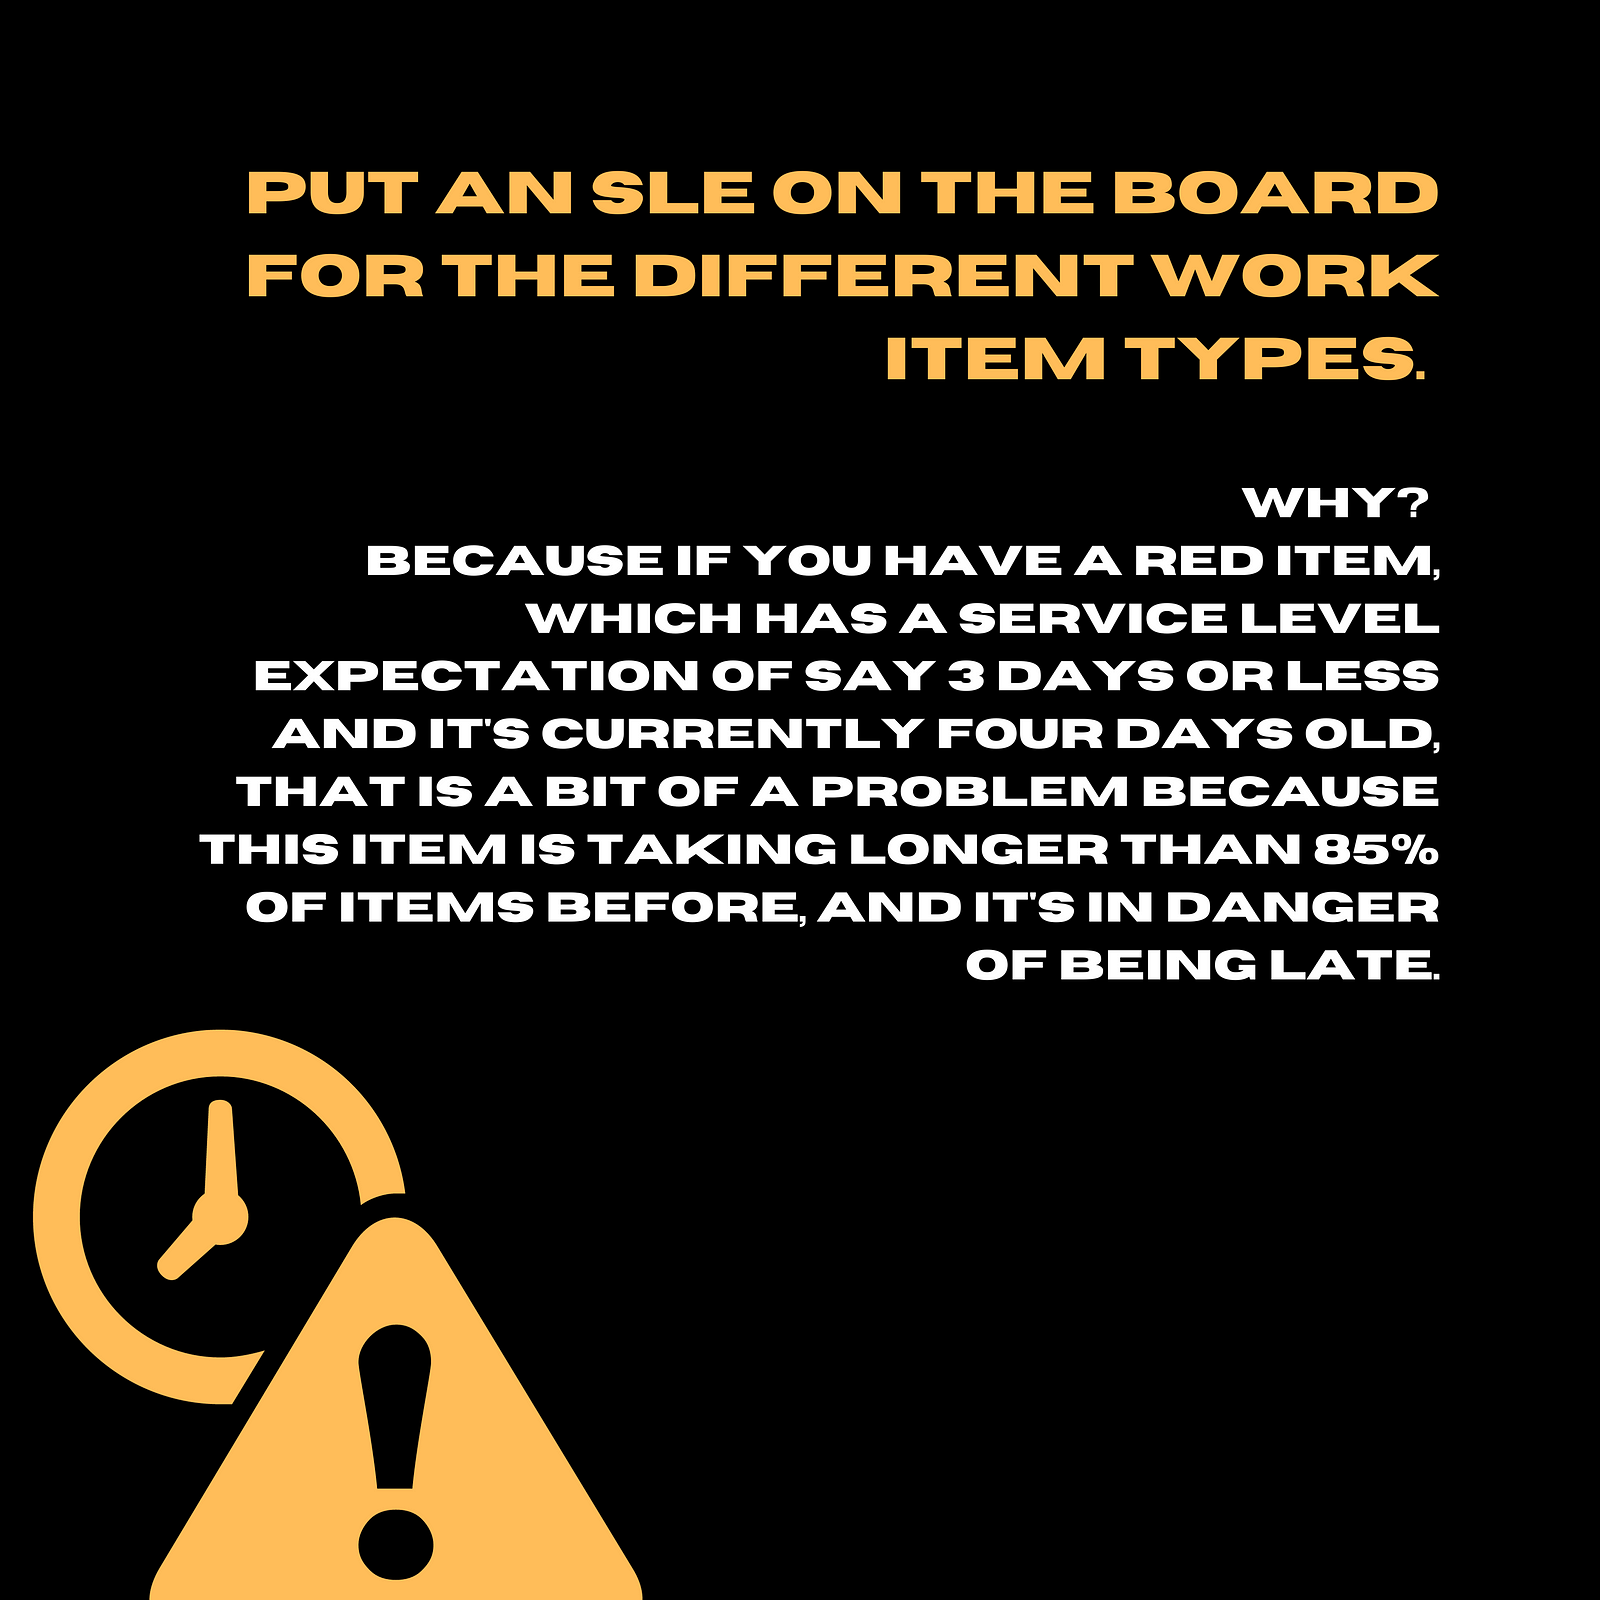
What I tend to do is put an SLE on the board for the different work item types. Why? Because if you have a red item, which has a Service Level Expectation of say 3 days or less and it’s currently four days old, that is a bit of a problem because this item is taking longer than 85% of items before, and it’s in danger of being late. It’s not even in the last column. So when you look at it in that lens, it’s much more useful.
In addition to that, on each work item on the board that’s in the system, you could report progress in terms of how is that item doing against its own Service Level Expectation.
You could, if you wanted to, have some kind of progress bar under each of these, saying, for this type of work item (e.g. a yellow item) that takes 10 days or less, how far through its SLE has it gone so far.
Kanbanize is a new feature that does that exactly, and I find it very, very useful. So what you can see on the card itself, there would be a progress bar underneath it. Imagine there was a green color on that. You can show that it’s made this much progress through its Service Level Expectation, but there’s still a bit to go. You could even have it going red as well if it was gone way beyond that.
Concluding Remarks
What I want to leave you with today is the idea that work item types can be useful. When you use work item types, don’t miss the opportunity of having a Service Level Expectation per work item type.
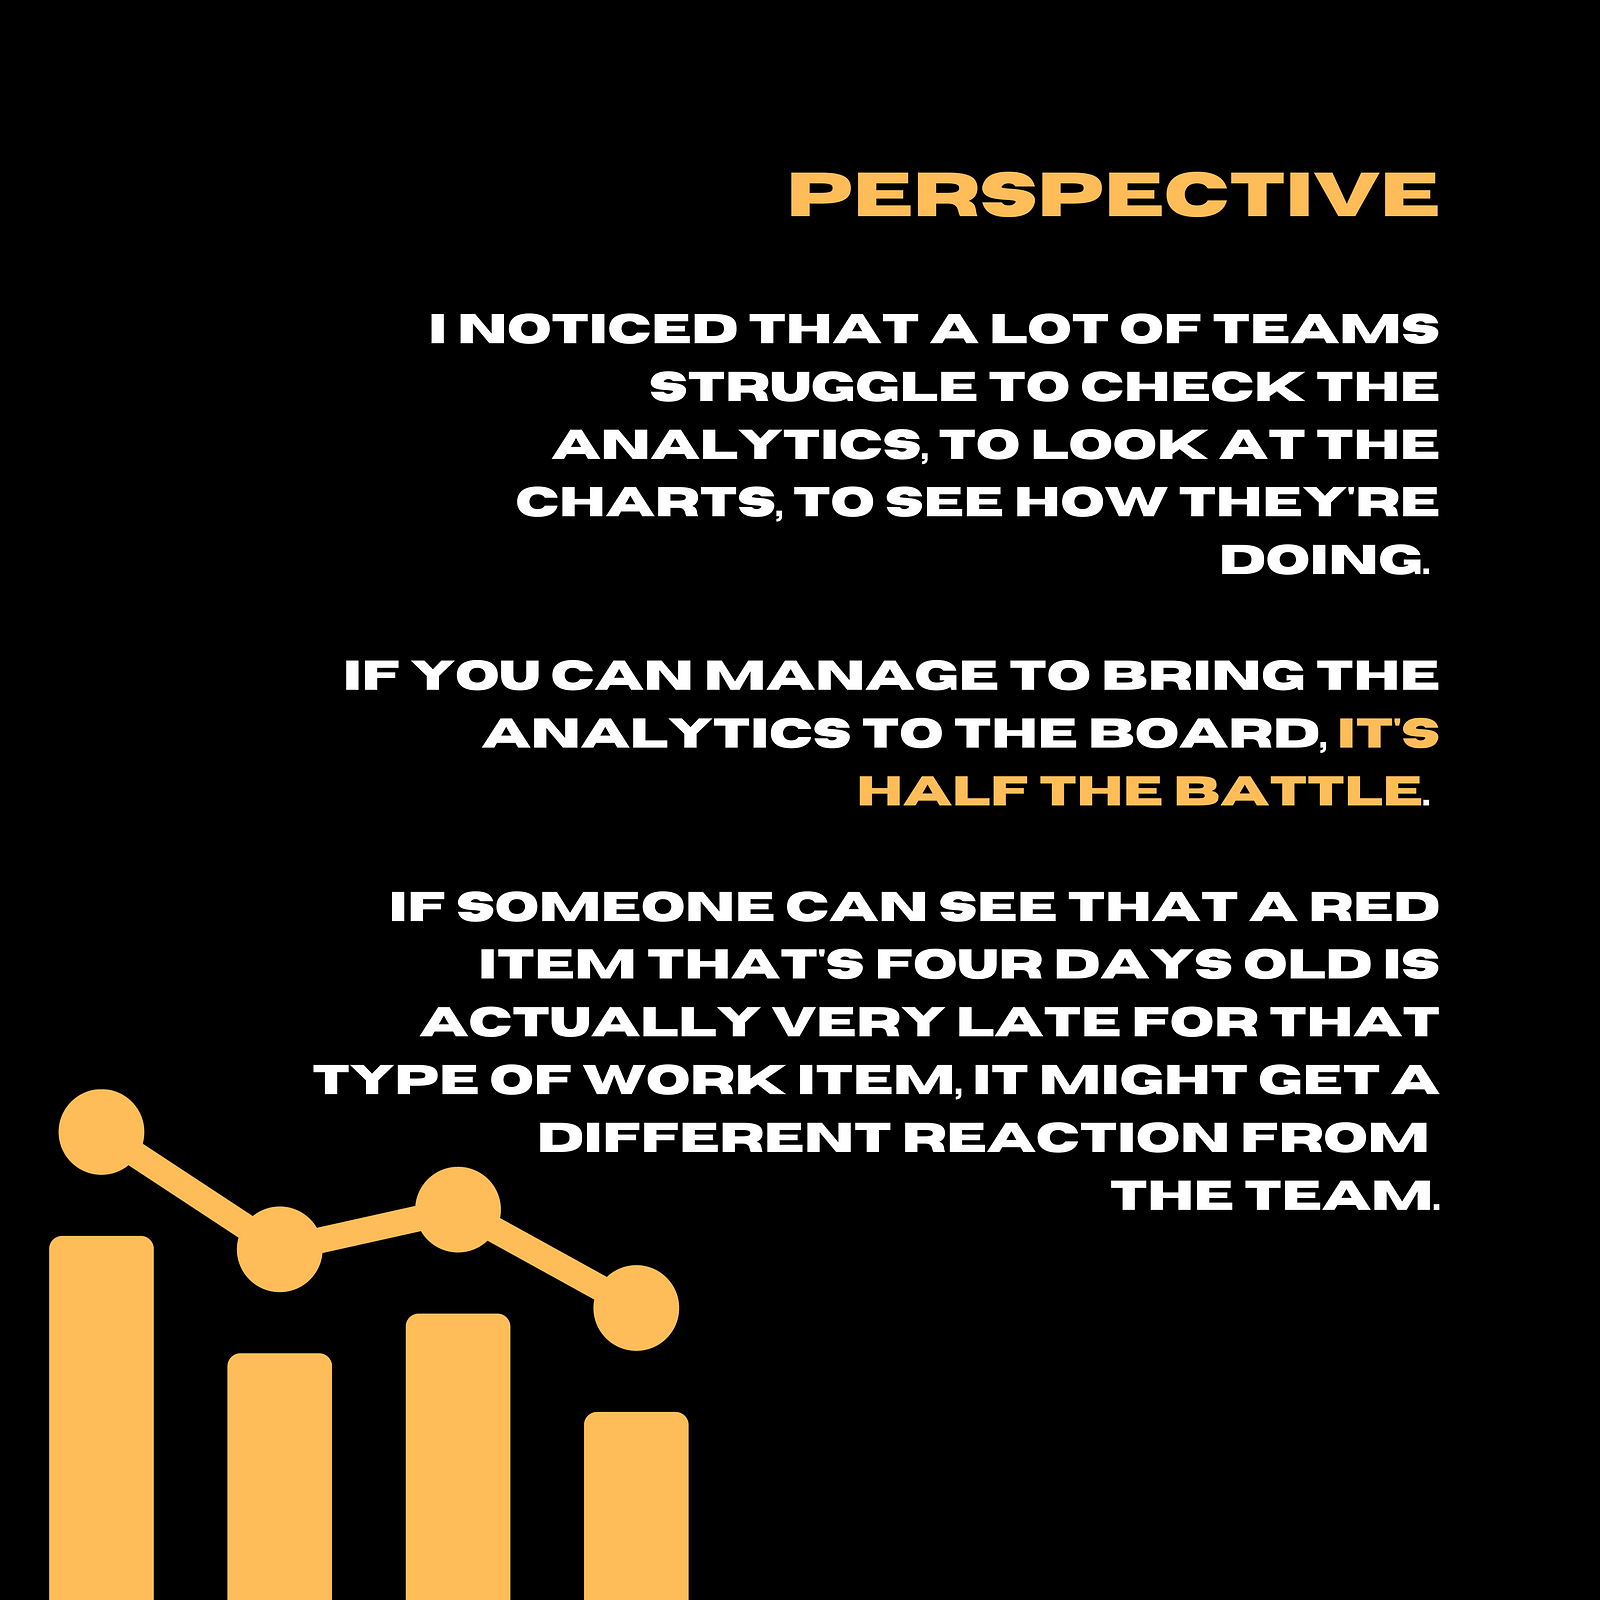
I noticed that a lot of teams struggle to check the analytics, to look at the charts, to see how they’re doing. If you can manage to bring the analytics to the board, it’s half the battle. If someone can see that a red item that’s four days old is actually very late for that type of work item, it might get a different reaction from the team. They might realize, hang on a second, only three in twenty items are as slow as this. Maybe we need to do something about this.
I’d like to say one other thing about service level expectations. While my preference is the 85th percentile, looking at the data, looking at cycle time scatter plot of all the cycle times of the work and so on, you could draw a ruler around, say, the 85th percentile and say, that’s my SLE for the 85th percentile. But if your 95th percentile was actually double that, what I tend to do in that case is I also publish the 95th percentile on the board, because it could actually be misleading.
People might think they’re okay. It’s fine. But actually, if the 95th percentile is double the cycle time of the 85th percentile because of so much unpredictability in the system, that’s useful information.
So if you can show that not only a work item has blown the 85th percentile, but it’s also blown the 95th, I think that makes people wake up and smell the coffee a little bit.
Work item types and service level expectations are really nice things to have on your Kanban board. Hopefully, you’re blessed enough to have some kind of tool that allows you to do this automatically. There are some other add-on tools that you can get in the market as well that might help you.
If you use a physical board, it should be fairly straightforward to do something like this.
Just again on work item types, they are optional. The reason I use work item types is to reduce the anxiety of the people using the board and to help people to feel more comfortable with the charts and the statistics that I might be showing to them.
We do have to strike a balance between looking at the metrics and having a bit of fun. You have to be careful that you don’t bash people over the head with these Service Level Expectations and work item aging charts to the extent that people are actually losing interest. You need to deal with the human factors as well. But as long as you’re not overplaying this card too much, I’d highly recommend that you think about having Service Level Expectations for work item types on your boards.